A Quick Guide to Mapping Your Process and Finding Problems
A Simple Guide to Process Flow Charting for Dental Practice Managers
In a previous article we discussed the power of flow charting when it comes to understanding waste. In this article we aim to provide a comprehensive step by step guide on how Flow Charting can be applied with little to no-knowledge of Lean.
What is a Process Flow Chart?
A process flow chart is like a map that shows all the steps in a task, from start to finish. It uses shapes and arrows to show what happens and in what order. The idea is that the Flow Chart represents a process step by step, decisions that are made, and different options that may be encountered.
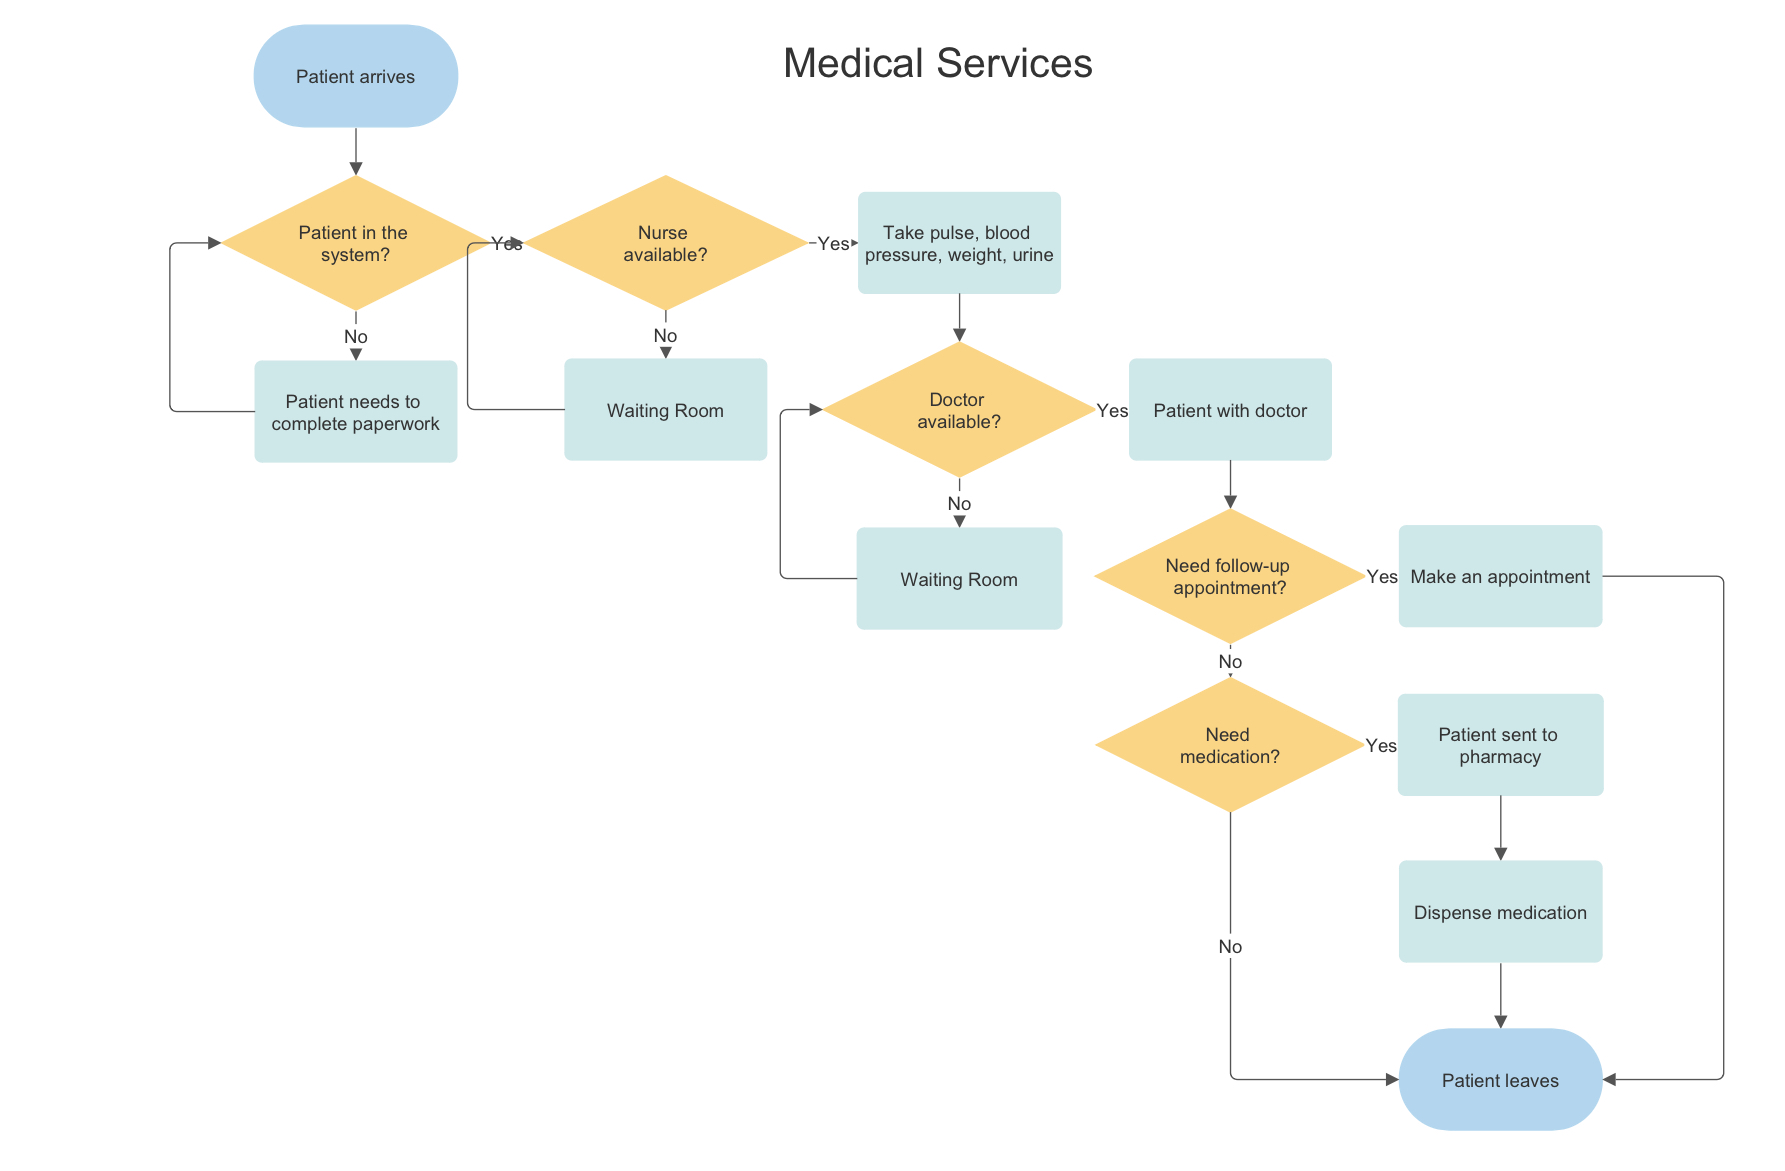
Why create a Flow Chart? It helps you see how things are done, find problems, and make things better. Below is an arbitrary example of a simple flow chart for medical service:

Courtesy of Smart Draw: an app that can be used for creating virtual flow charts.
Example: Patient Check-in Process
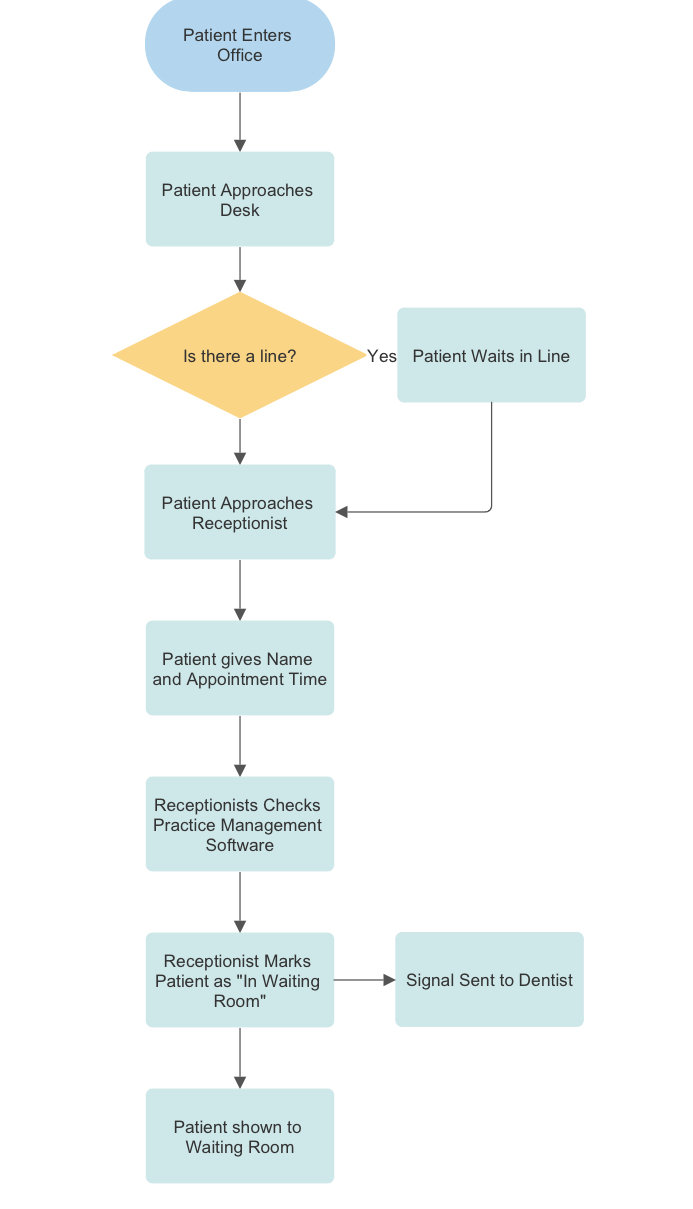
Let's say we want to improve how patients check in for their appointments. Specifically we want to look into the steps from when a patient walks into a practice to the point where the dentist receives a notification that the patient has arrived.
Step 1: Choose What to Map
Pick a process you want to make better. In our example, we're looking at how patients check in.
Step 2: Set the Boundaries
Decide where the process starts and ends.
Start: Patient enters the office
End: Patient sits in waiting room
Step 3: Gather Information
There is a couple of ways to achieve this:
Gather people that work in the process and get them to help you understand ‘what actually happens’ - and not what is supposed to happen. Be sure to include your receptionists (account for different shifts or tenure), practice manager and dentists.
Watch the process happen and write down each step. Ask the staff what they do. Again, account for variations in ways of working across tenure or shifts.
Step 4: Draw the Flow Chart
Use simple shapes to show each step:
Oval: Start and end
Rectangle: Action steps
Diamond: Decision points
Arrows: Show direction
Here's a simple example:

Step 5: Look for Waste
Now that you can see all the steps, look for things that slow down the process or don't add value. This can be collected anectodally - from your staff members and through observations. These might be:
Waiting times: how long do patients wait to speak to receptionist & check in? How long do they wait for in the waiting room?
Repeated steps: how often are patients asked for the same information? For example - do dentists use the Patient Card Notes to find out why the patient is visiting? Or do they ask Patients to re-explain?
Unnecessary movement: Are receptionists standing up and physically showing the waiting room? How often is that happening? Why is that happening? Can signage be made more clear?
Extra paperwork: What data are receptionists inputting?
Step 6: Ask Questions & Go Deeper
Let’s take “Patient waiting in line” as a case study. How would we dive deeper? Below is an example of how a simple response would be broken down further to evaluate the root of the problem. The process of continuously asking WHY until we get to an actionable cause is called 5-WHY:
Why do patients have to wait in line?
Because receptionists are busy.
Why are they busy?
Because they are handling multiple jobs at the same time.
Why are they handling mutiple jobs?
Because they receive multiple requests from all dentists in the practice.
Because there is no prioritisation setup.
Because we spend time transcribing patient information.
Why do we spend time transcribing information?
Because patients provide all their information when they arrive.
Why do they provide the information when they arrive?
Because we have no platform to capture their details before hand.
Step 7: Make it Better
Think of ways to remove waste, utilise your current systems more effectively, or implement new ones:
Have an online check-in system
Have check-in screens at reception.
Send forms to patients before their visit
Create a prioritisation system for receptionists.
All of these examples could help support the check-in process we analysed earlier.
Step 8: Draw a New Flow Chart
Make a new chart showing how the process would work with your improvements.
Step 9: Try It Out
Test your new process to see if it works better.
Step 10: Keep Improving
Keep watching and asking how to make things even better.
Remember, the goal is to make things smoother and easier for both patients and staff. By mapping out the process, you can see where the bumps are and fix them!
Although this small guide should be able to help you carry out this analysis as a DIY, we appreciate Dental Practices are busy on the tools and providing the best care for their patients. So don’t forget - we are here to help should you want us to run these sessions!
Sources:
How to Create a Process Flow Chart (and why you should): https://www.frevvo.com/blog/process-flow-diagram/
Understanding and Using a Process Flow Chart: https://www.solvexia.com/blog/what-is-a-process-flowchart-and-how-to-use-it
What is Process Flow, and how can you visualise it? https://asana.com/resources/process-flow
What is a Flow Chart? https://asq.org/quality-resources/flowchart